Most reports look fine, so nobody checks them. The totals add up, the charts render, and the pack goes to the board. Then one figure turns out to be wrong. A duplicated record, a late load or a quietly changed schema has skewed a metric, and no one can say where the error entered. Once that happens, people stop trusting every chart you show them. This is why data quality belongs in the build, treated as a feature you design and test, not a clean-up job you do after someone complains.
The quiet cost of bad data
Bad data rarely fails loudly. A pipeline does not throw an error when a number is merely wrong. The load finishes, the dashboard refreshes, and the mistake travels straight into a decision. That is what makes it expensive. The cost lands later, in a call that was made on a figure that did not hold.
The research puts numbers on it, and they are large and consistent across sources over almost a decade.
- USD 12.9 million
- Average annual cost of poor data quality (Gartner)
- 15 to 25% of revenue
- Estimated cost of bad data (MIT Sloan)
- 47%
- New records with at least one critical error (Harvard Business Review)
- 3%
- Data quality scores rated acceptable (Harvard Business Review)
Data quality is a feature, not a clean-up job
A clean-up job starts after the damage. Someone spots a bad figure, you trace it, you patch the record, and you wait for the next surprise. It is reactive, and it never ends.
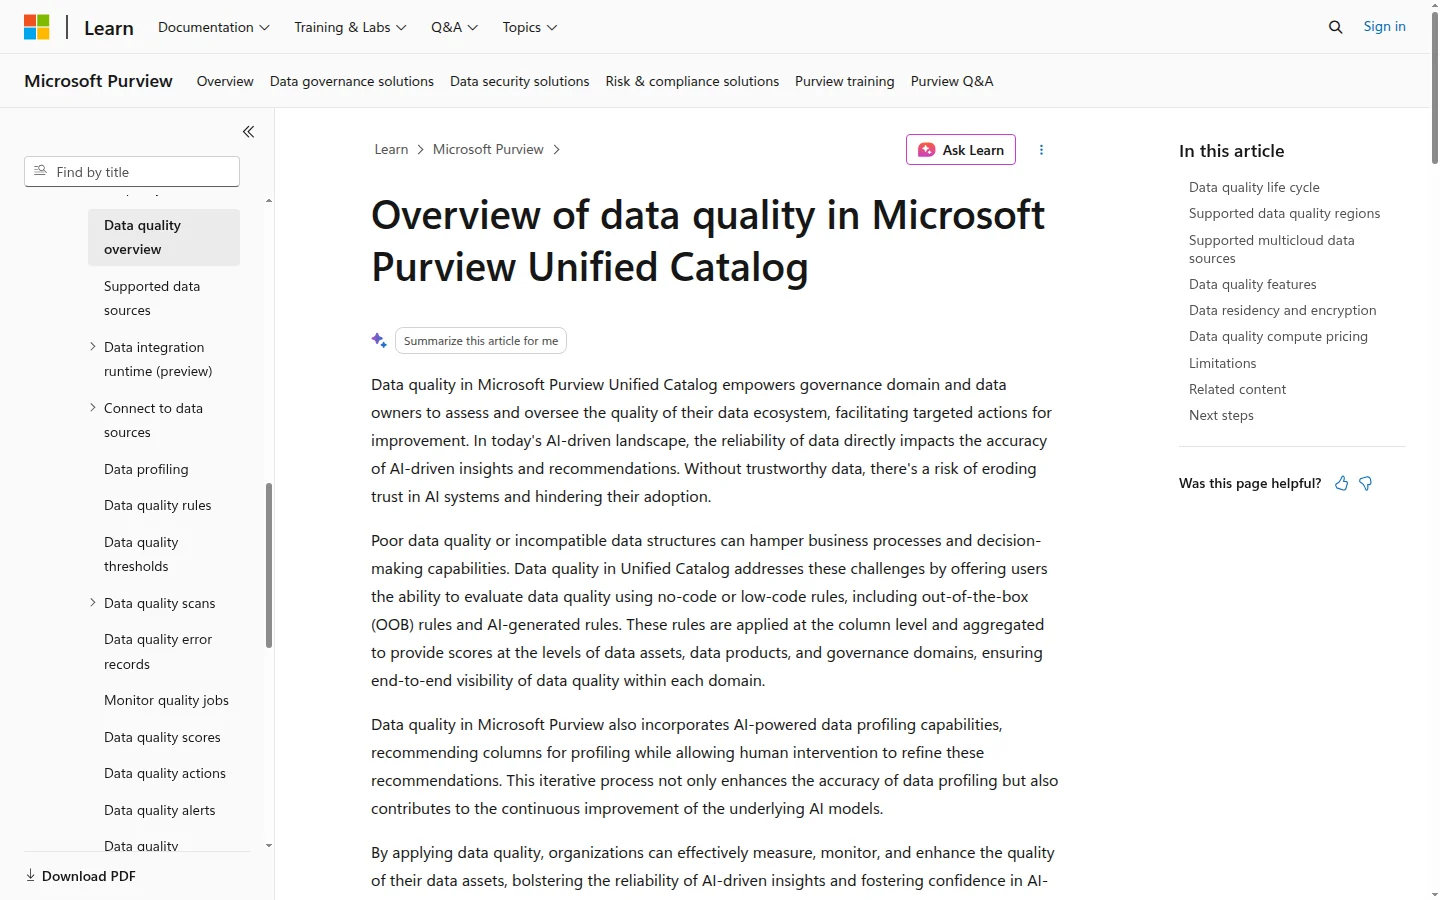
Treat quality as a feature and the work moves to the front. You decide what good looks like for each dataset, you write checks that test it, and you give every check an owner. The pipeline proves the data before anyone reads it. Microsoft makes the same case for governed data.
Poor data quality or incompatible data structures can hamper business processes and decision-making capabilities.
What we check
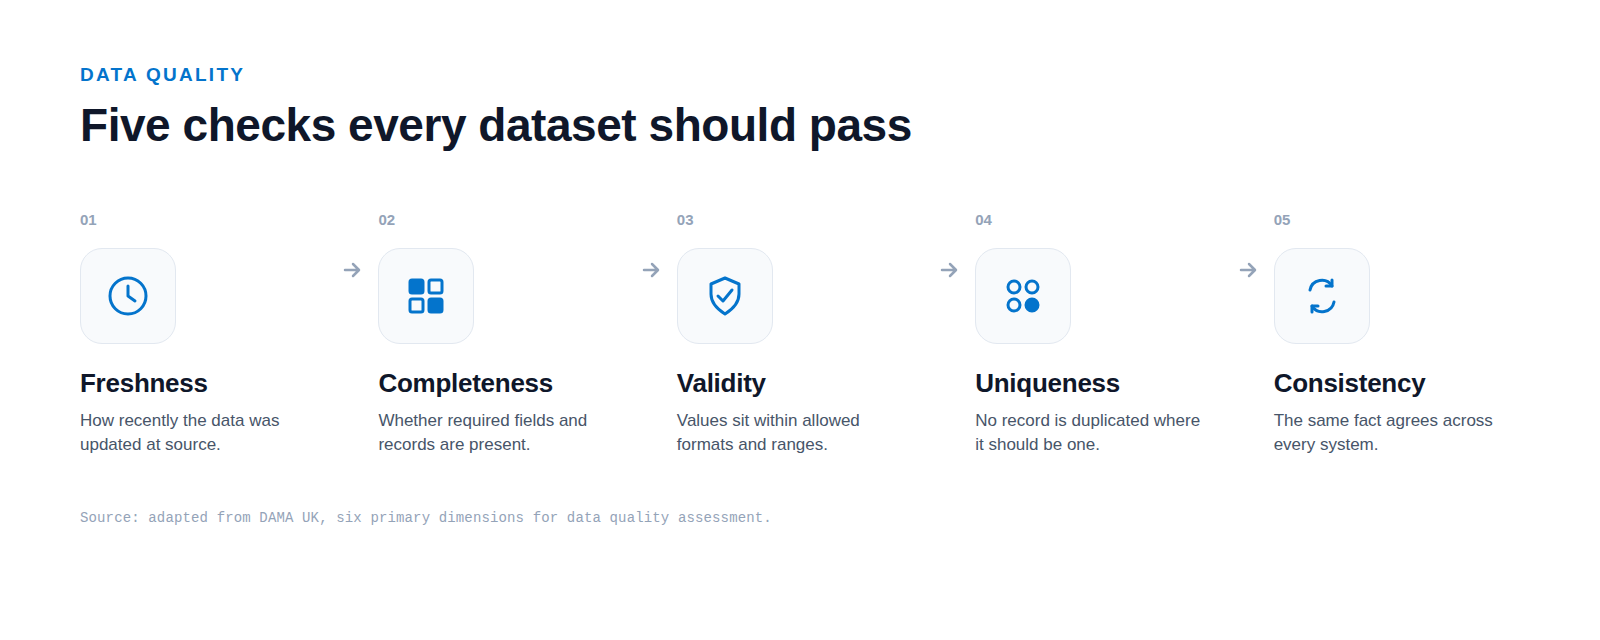
You do not need a large programme to start. Five checks catch most of the errors that reach a board pack.