A market that is turning
If you run a property team in Australia right now, you are being asked one question on repeat: is this suburb heating up, or cooling down? The market has turned. National dwelling values are falling month on month through 2026, yet the two price indices most teams pay for do not agree on how fast. Real estate analytics earns its keep here, by turning a wall of clashing numbers into one read you can defend.
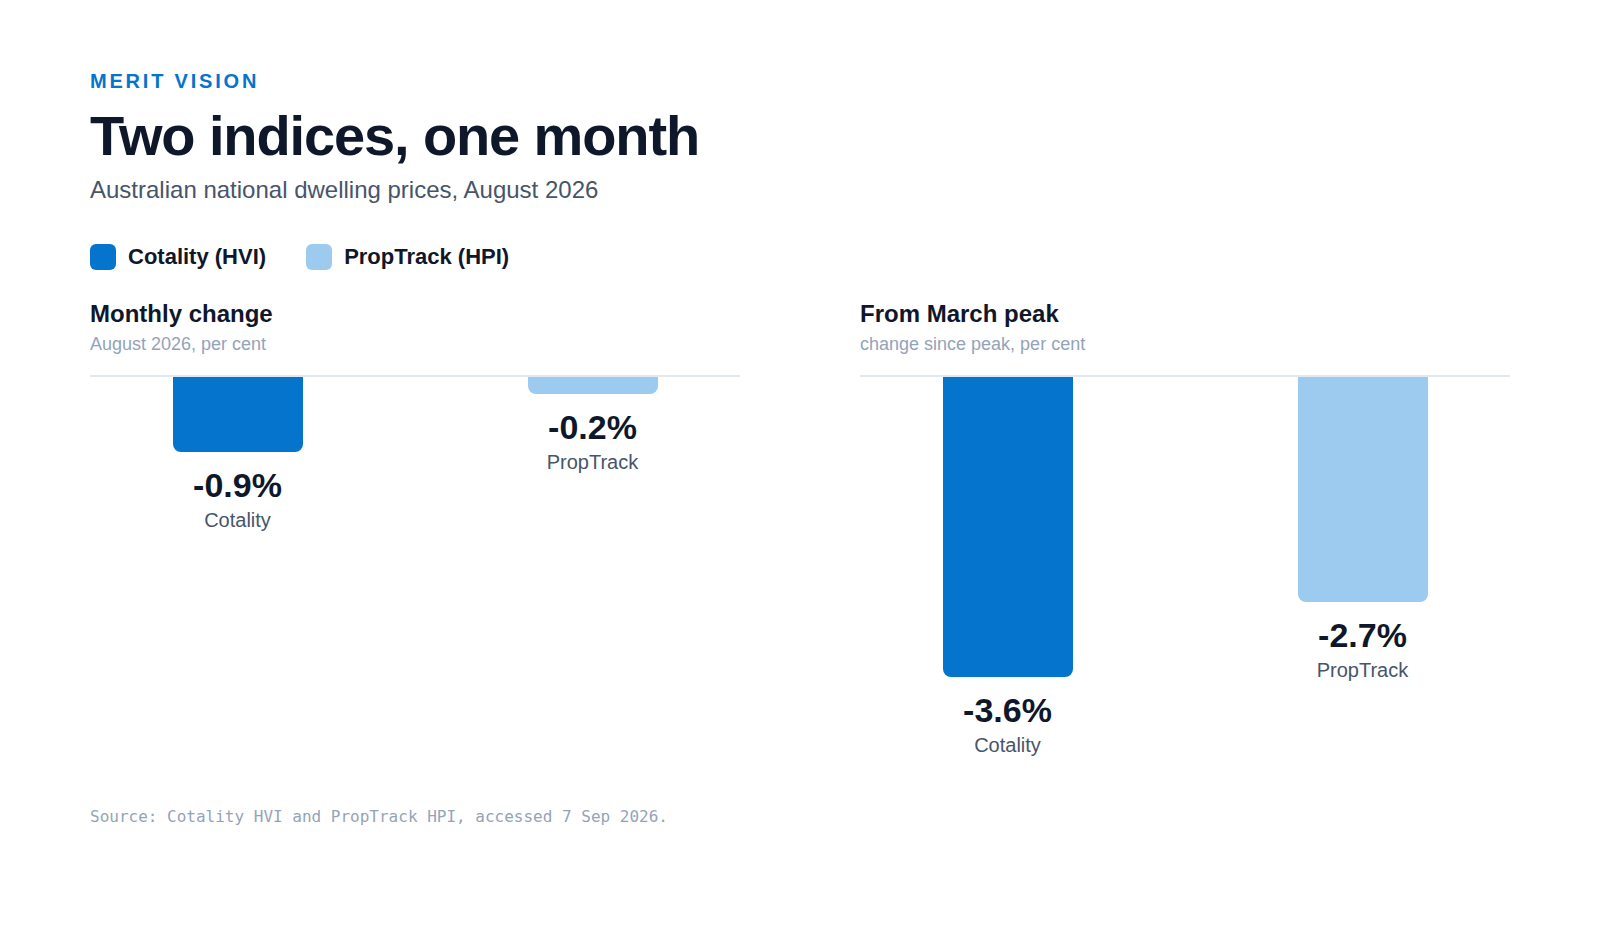
Take August 2026. Cotality put the national fall at 0.9% for the month. PropTrack put it at 0.2%. Both called it the fifth consecutive monthly fall, and both dated the peak to March 2026. Same market, same month, two different sizes of the same decline.
The disagreement is not noise. It changes the answer you give your board. Read the wrong index, or read a single snapshot instead of a trend, and you will call the turn late.
Why real estate analytics data is messy
Listings, sales and rentals arrive in different shapes. Different units, different coverage, different refresh cadences. One feed updates weekly, another monthly. One counts a sale at contract, another at settlement. Before you can trust a trend, you have to make the numbers mean the same thing.
The August 2026 gap between the two national indices shows the problem plainly. Cotality measured the fall from the March peak at 3.6%. PropTrack measured it at 2.7%. On Sydney, Cotality reported values down 4.6% over the year while PropTrack reported down 3.6%. Neither is wrong. They use different methods, coverage and revision timing, so they land in different places.
This is where the work sits. Standardise addresses to one format. Geocode each record to a postcode. Reconcile duplicates so a single property is not counted three times. Do that first, and every median, yield and days-on-market figure downstream compares like with like.
The signals that matter
You do not need fifty metrics on a wall. Four signals, read as trends rather than single snapshots, tell you most of what a suburb is doing and whether the direction is holding.
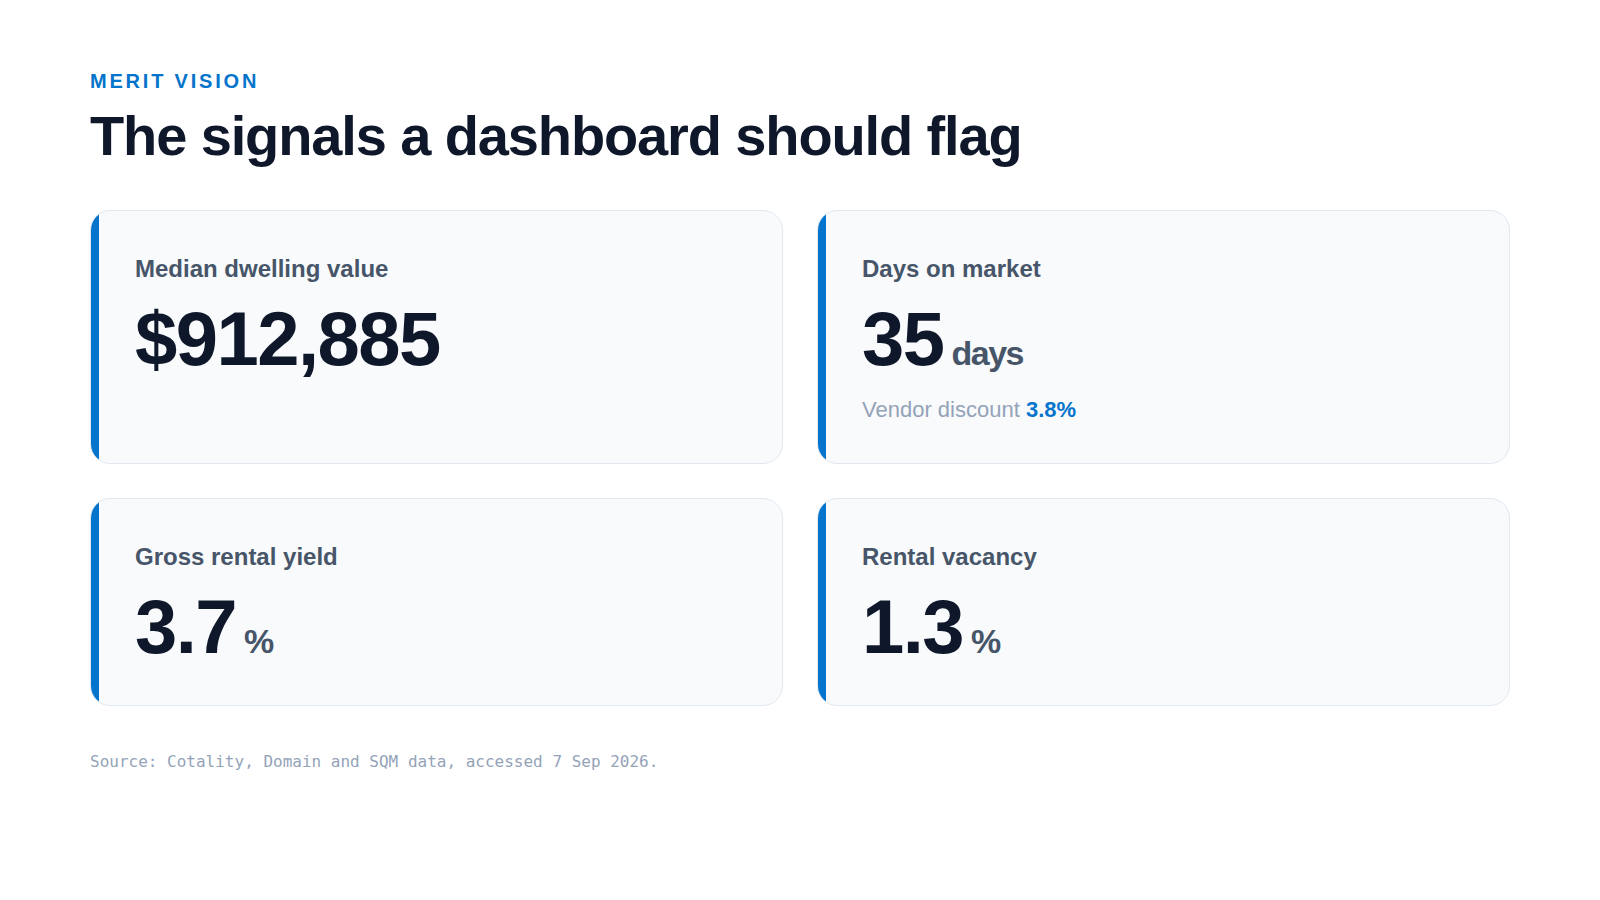
- Median price and its trend, by postcode. The national median dwelling value sat at $912,885 in August 2026, but the national number hides the story. Over the year to August, Perth values rose 15.6% while Sydney fell 4.6%. Same country, opposite directions.
- Days-on-market and vendor discounting. The median time to sell across the capitals was 35 days in the three months to July 2026, with a median vendor discount of 3.8%, both widening. Auction clearance rates have sat below 50% since late May 2026. When time-to-sell and discounts rise together, demand is cooling.
- Rental yield, to compare suburbs for investors. The national gross rental yield was 3.7%, with the national median rent at a record $705 per week and annual rent growth of 5.9%. Yield tells you what the income side is doing while prices soften.
- Supply against absorption. National rental vacancy held at 1.3% in July 2026, about 40,771 empty dwellings, while combined-capital sales volumes fell 3.5% over the year to July. Tight rentals against slower sales is a real tension worth watching.
From data to decision
A signal only helps if it is paired with a threshold. A dashboard that shows a median is a report. A dashboard that flags when days-on-market and discounting climb together, or when listings clear fast against tight vacancy, is a decision tool. The first tells you what happened. The second tells you what to do next.
- $912,885 (Cotality, Aug 2026)
- National median dwelling value
- 35 days, 3.8% vendor discount (Cotality, to Jul 2026)
- Median days to sell
- 3.7% (Cotality, Aug 2026)
- National gross rental yield
- 1.3% (SQM via Property Update, Jul 2026)
- National rental vacancy
Set the thresholds once, with your own risk appetite, and the dashboard does the watching. You get an alert when a suburb crosses from steady to cooling, not a spreadsheet you have to re-read every Monday.
Put a number on the whole market
It helps to keep the scale in mind. The Australian Bureau of Statistics valued the country's residential dwellings at $12,772.6 billion in the March quarter of 2026, across 11,495,200 dwellings, a mean price of $1,111,100. Against a base that large, a 0.9% monthly move is not a rounding error. It is billions of dollars, and it is why small percentage changes deserve close reading.
Track your patch
You already have the data: listings, sales, rental feeds and a couple of index subscriptions. What you are missing is one trustworthy read per suburb and an alert when it turns. Point RS Core at your feeds to reconcile them to comparable numbers, then use RS AUS Dashboard to watch the four signals for your own patch. See both at /subs-services/rscore and /subs-services/rs-aus-dashabod.
The teams who answer heating or cooling with confidence are not the ones with the most data. They are the ones whose data agrees with itself.
Sources
- Cotality Home Value Index tracker (August 2026 figures), Property Investment Professionals (accessed 2026-09-07)
- Monthly Housing Chart Pack, August 2026, Cotality (accessed 2026-09-07)
- Australian home prices fell for a fifth consecutive month in August, PropTrack Home Price Index report via Property Update (accessed 2026-09-07)
- Domain House Price Report June quarter 2026, investor analysis, Property Investment Professionals (accessed 2026-09-07)
- The latest rental vacancy rates around Australia (SQM Research July 2026 data), Property Update (accessed 2026-09-07)
- Total Value of Dwellings, March quarter 2026 (latest release), Australian Bureau of Statistics (accessed 2026-09-07)